Still In Correction
It has been some time seen I’ve looked at longer term charts of the STI to see the big picture. So, before I comment on the Daily Chart above, let us look at the Monthly and Weekly Charts.
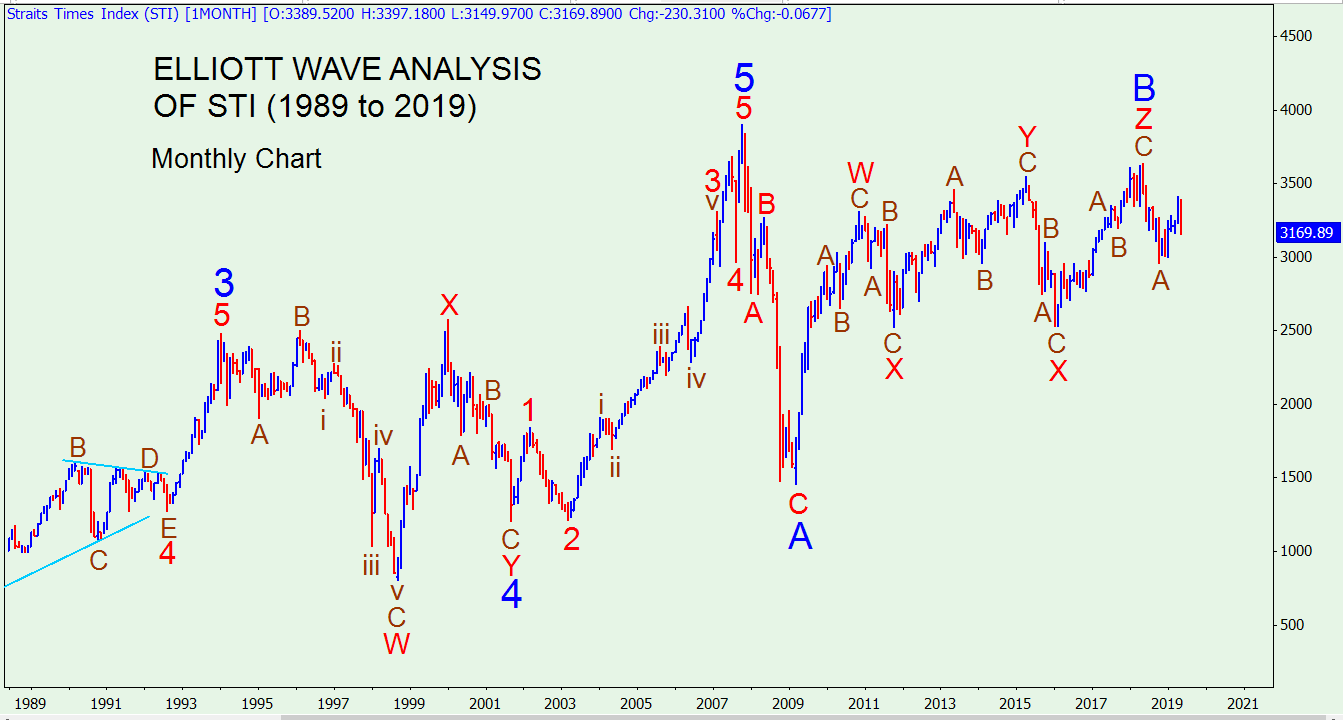
It can be seen that after the 2009 crisis the STI recovered with a strong upward wave, labelled Wave W (red). This had three subwaves and so it was a counter-corrective wave. Since then (November 2011), the STI has been meandering sideways. It had a down Wave X, an up Wave Y, a down Wave X and an up Wave Z, all coloured red. This whole structure is labelled Wave B (blue) and is a triple-three wave. Let us now look at the Weekly Chart.
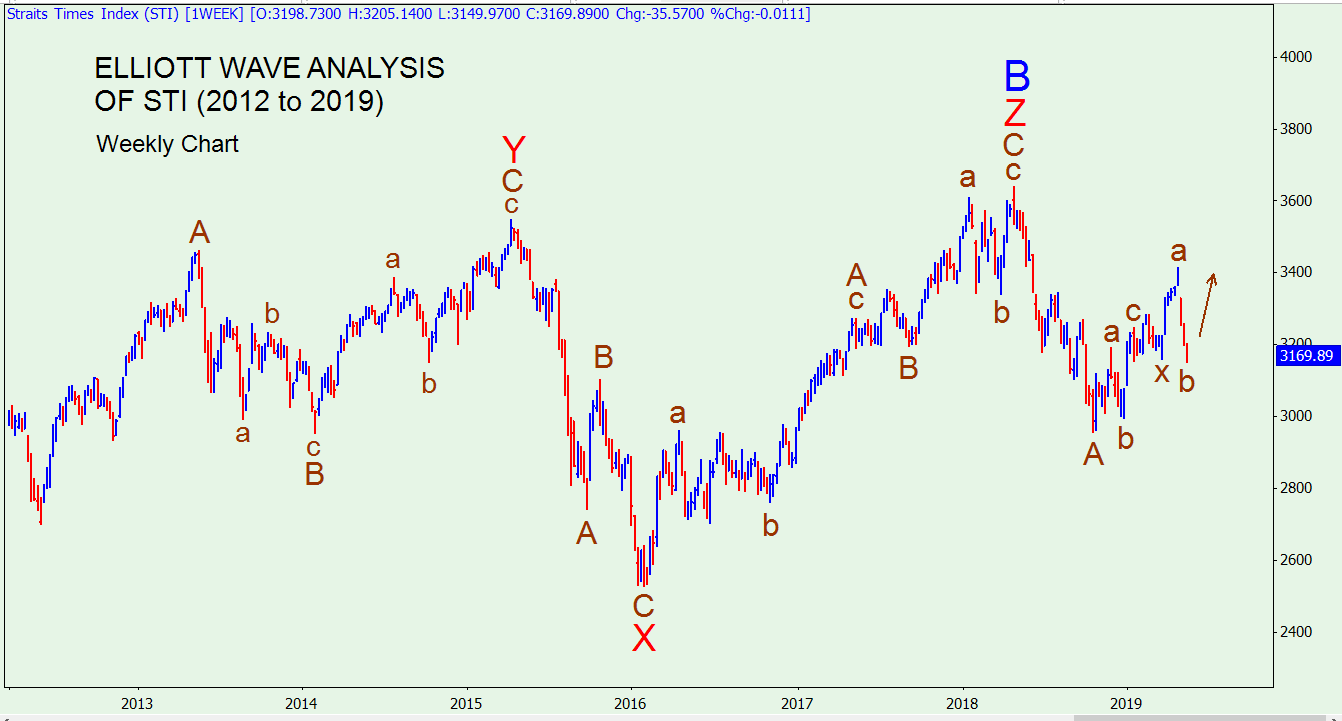
You can synchronise the Weekly and Monthly Charts by looking at the recent STI high, labelled B(blue) Z(red) C(brown) in the two charts. The Weekly Chart shows the subsequent structure in greater detail. The STI formed Wave A (brown) down from the recent high. This has three subwaves and hence is corrective. It looks like the STI is now forming a counter-corrective wave which could be a double-three wave. Let us now move back to the Daily Chart at the top.
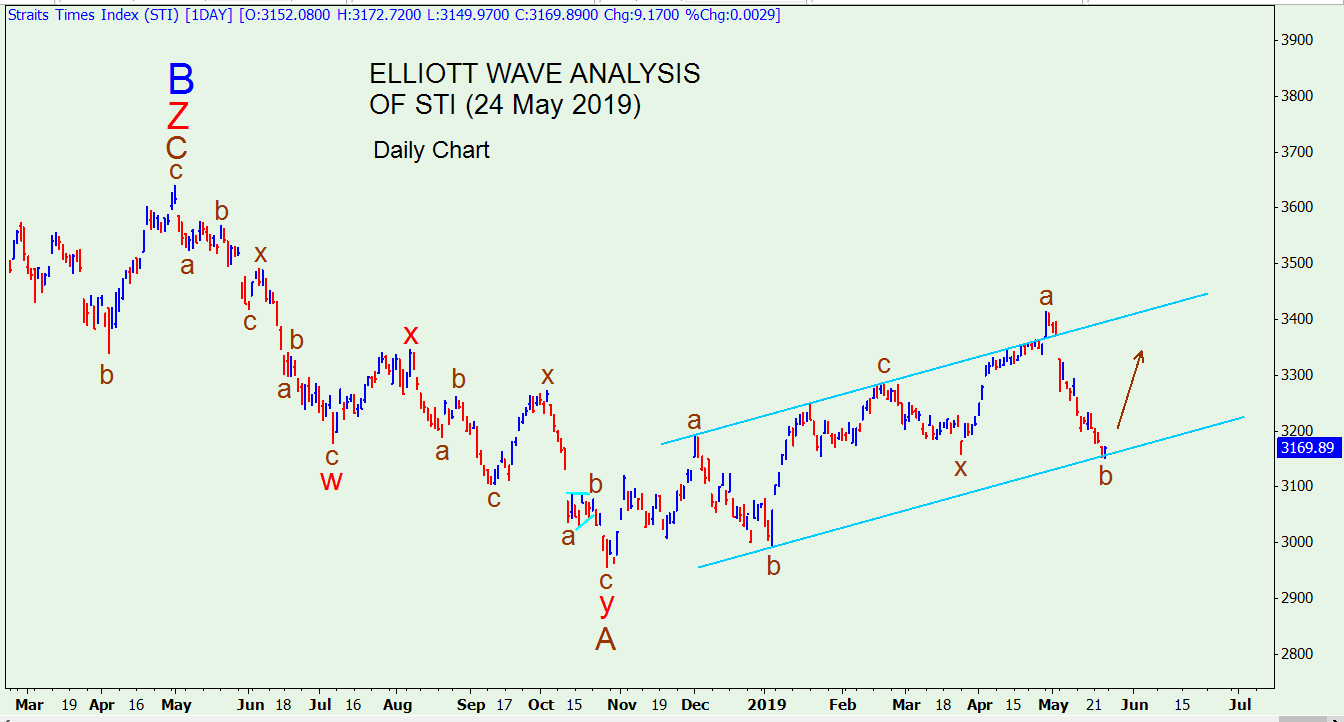
Again you can use the recent STI high labelled BZC to synchronise the Daily Chart with the other Charts. In the Daily Chart you can see the substructure of the Wave A which consists of Subwaves wxy (red). Subsequently there is a counter-corrective wave which is enclosed in parallel blue lines. It looks like the STI will rise upwards next week to complete with a Wave c (brown).
It is anybody’s guess as to what will happen next. The global uncertainty has worsened with the US-China trade war expanding into non-trade issues and with heightened threats in Middle East as well.